Note
Go to the end to download the full example code.
Brillouin zone#
Plot the Brillouin zone of a monoclinic lattice:
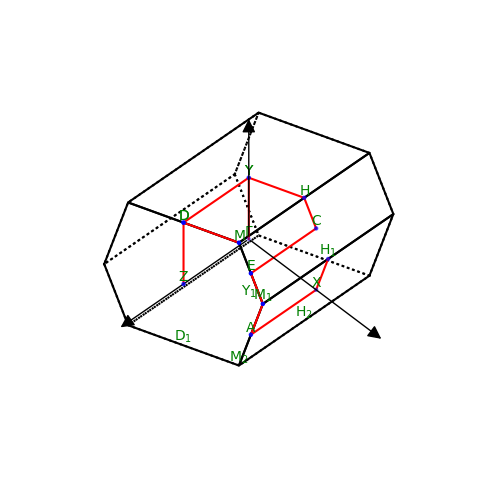
<Axes3D: >
from ase.lattice import MCL

lattice = MCL(3.0, 4.0, 5.0, alpha=70.0)
lattice.plot_bz()

Note
Go to the end to download the full example code.
Plot the Brillouin zone of a monoclinic lattice:
<Axes3D: >
from ase.lattice import MCL
lattice = MCL(3.0, 4.0, 5.0, alpha=70.0)
lattice.plot_bz()