
Note
Go to the end to download the full example code.
Band-structure#

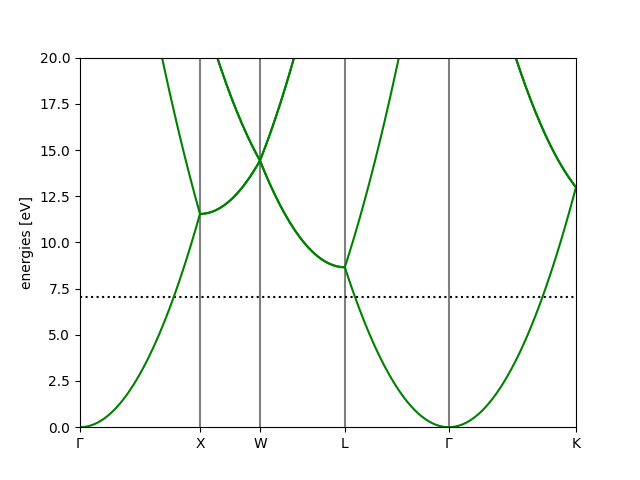
<Axes: ylabel='energies [eV]'>
from ase.build import bulk
from ase.calculators.test import FreeElectrons

atoms = bulk('Cu')
band_path = atoms.cell.bandpath('GXWLGK', npoints=200)
atoms.calc = FreeElectrons(nvalence=1, kpts=band_path)
atoms.get_potential_energy()
bs = atoms.calc.band_structure()
bs.plot(emin=0, emax=20, filename='cu.png')