
Note
Go to the end to download the full example code.
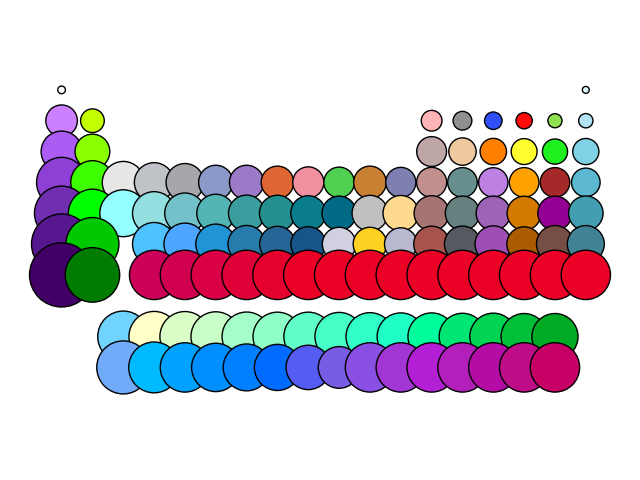
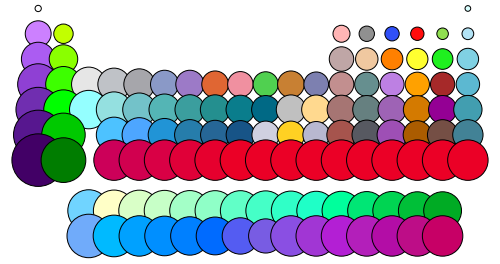
Periodic Table#
import matplotlib.pyplot as plt

from ase.utils.ptable import ptable
from ase.visualize.plot import plot_atoms

atoms = ptable()
atoms.write('ptable.png')

fig, ax = plt.subplots()

plot_atoms(atoms, ax=ax)
ax.set_axis_off()
fig.tight_layout()

# Calling "povray ptable_pov.ini" will render it with povray.
# atoms.write('ptable_pov.pov')

# from ase.visualize import view
# view(atoms)